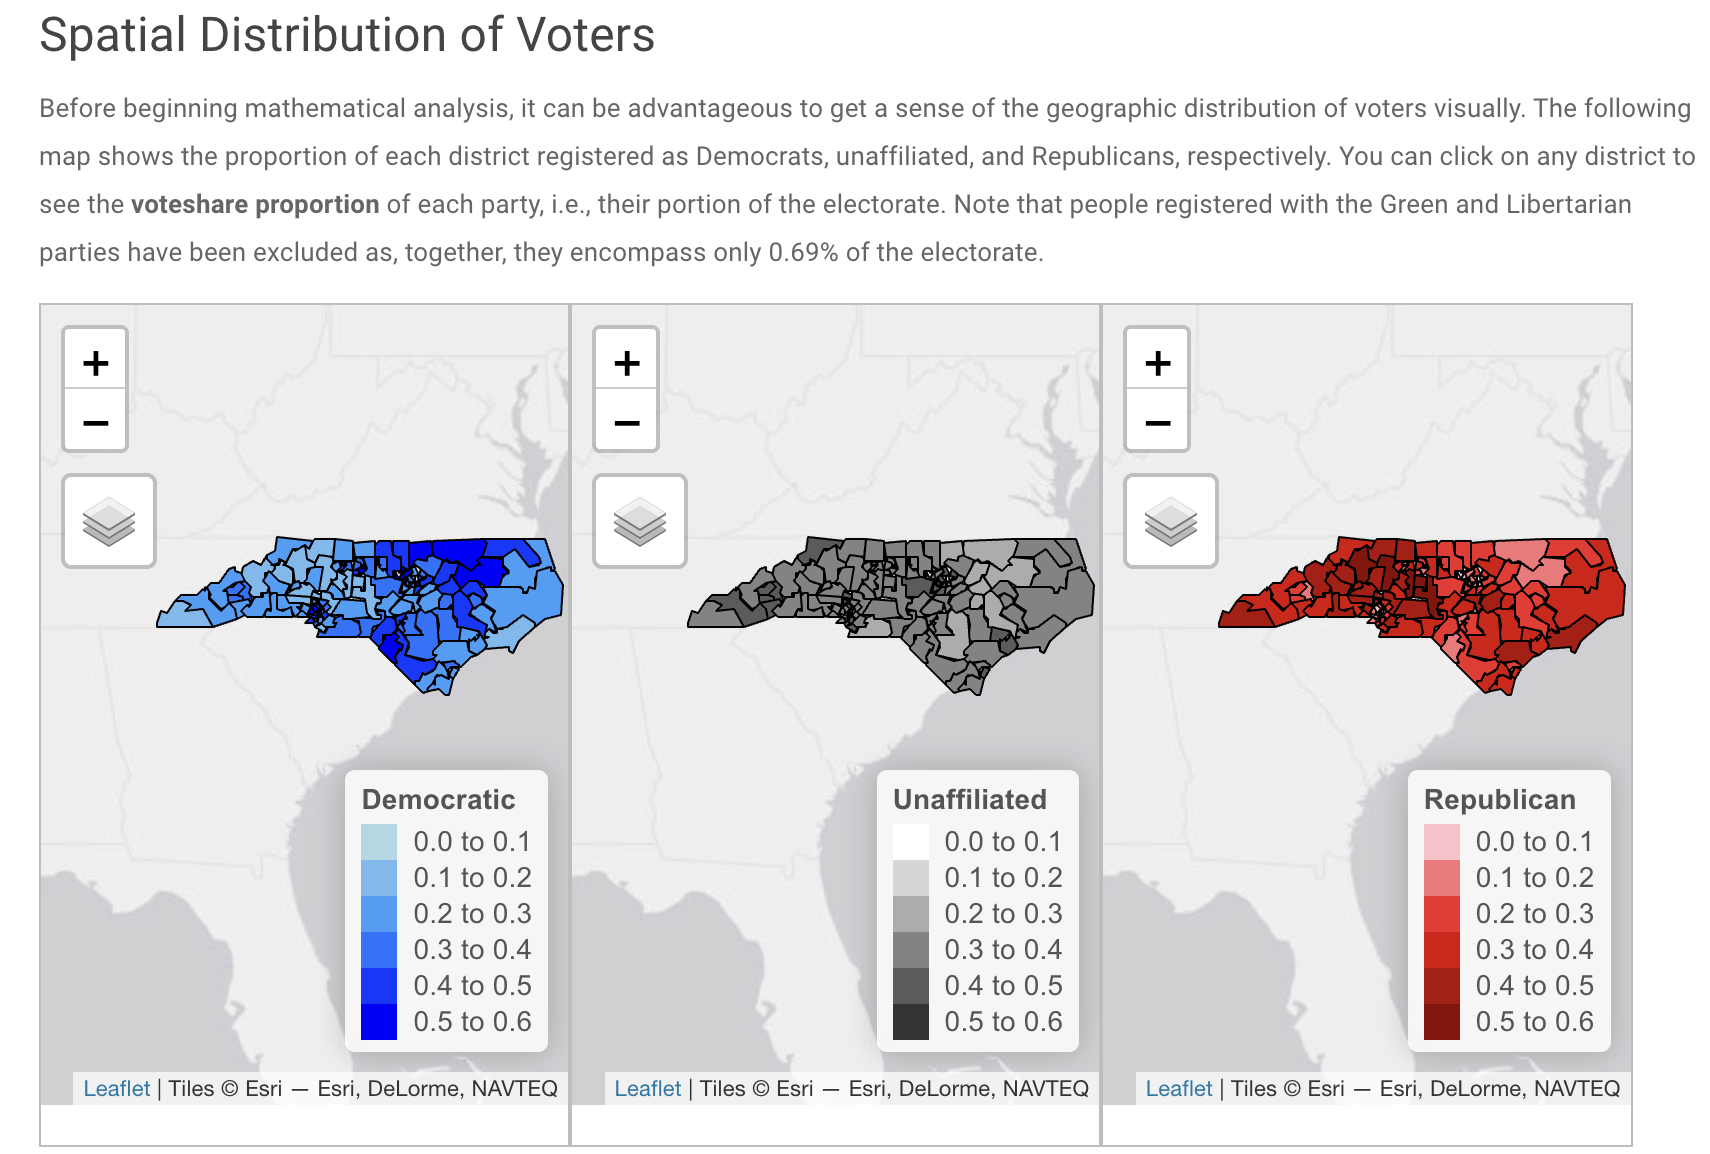
Spatial Autocorrelation and Predictive Modeling of NC Voter Distribution (Interactive)
Analyzing 8.3M voter records to measure electoral clustering and predict turnout.
Papers and projects spanning spatial analysis, policy, and qualitative research.
Analyzing 8.3M voter records to measure electoral clustering and predict turnout.
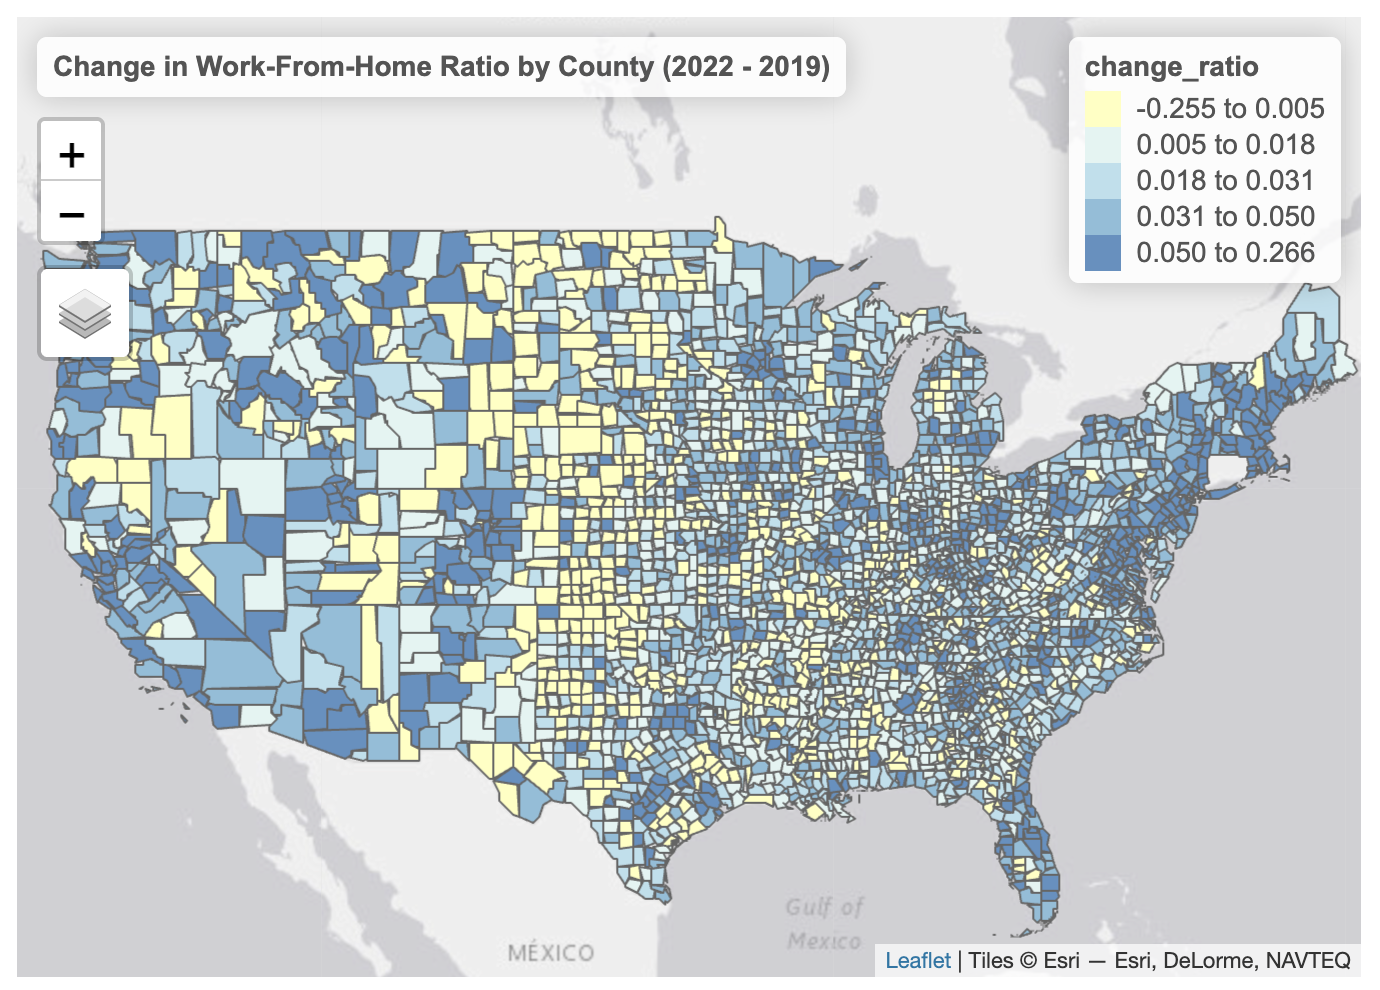
Choropleth and interactive visualizations of county-level remote work changes.
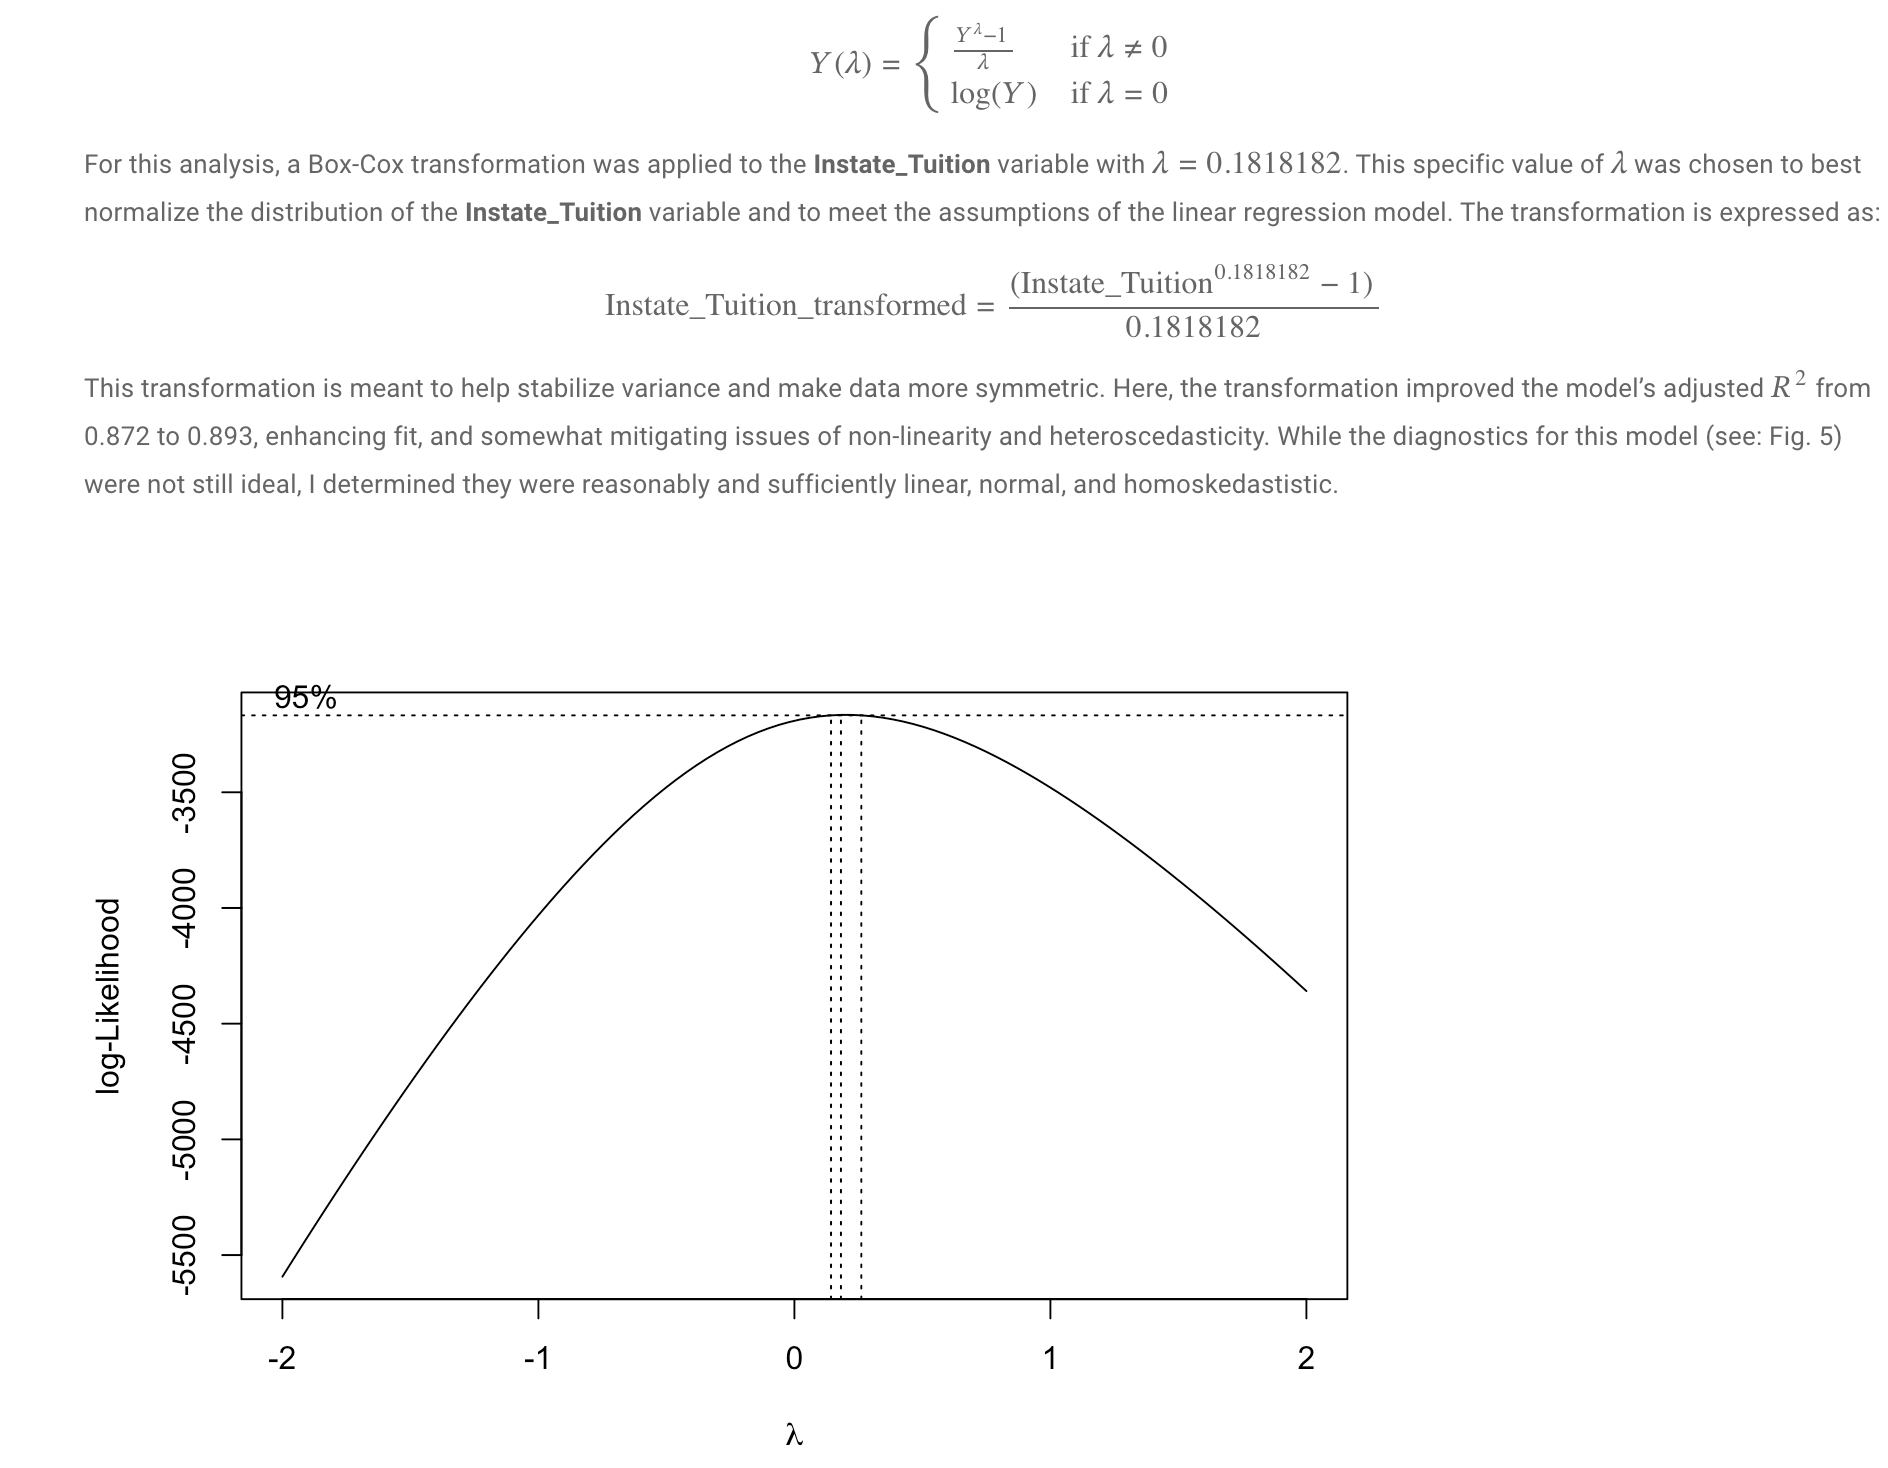
Interactive dashboard / visualization of tuition predictors and spatial patterns.
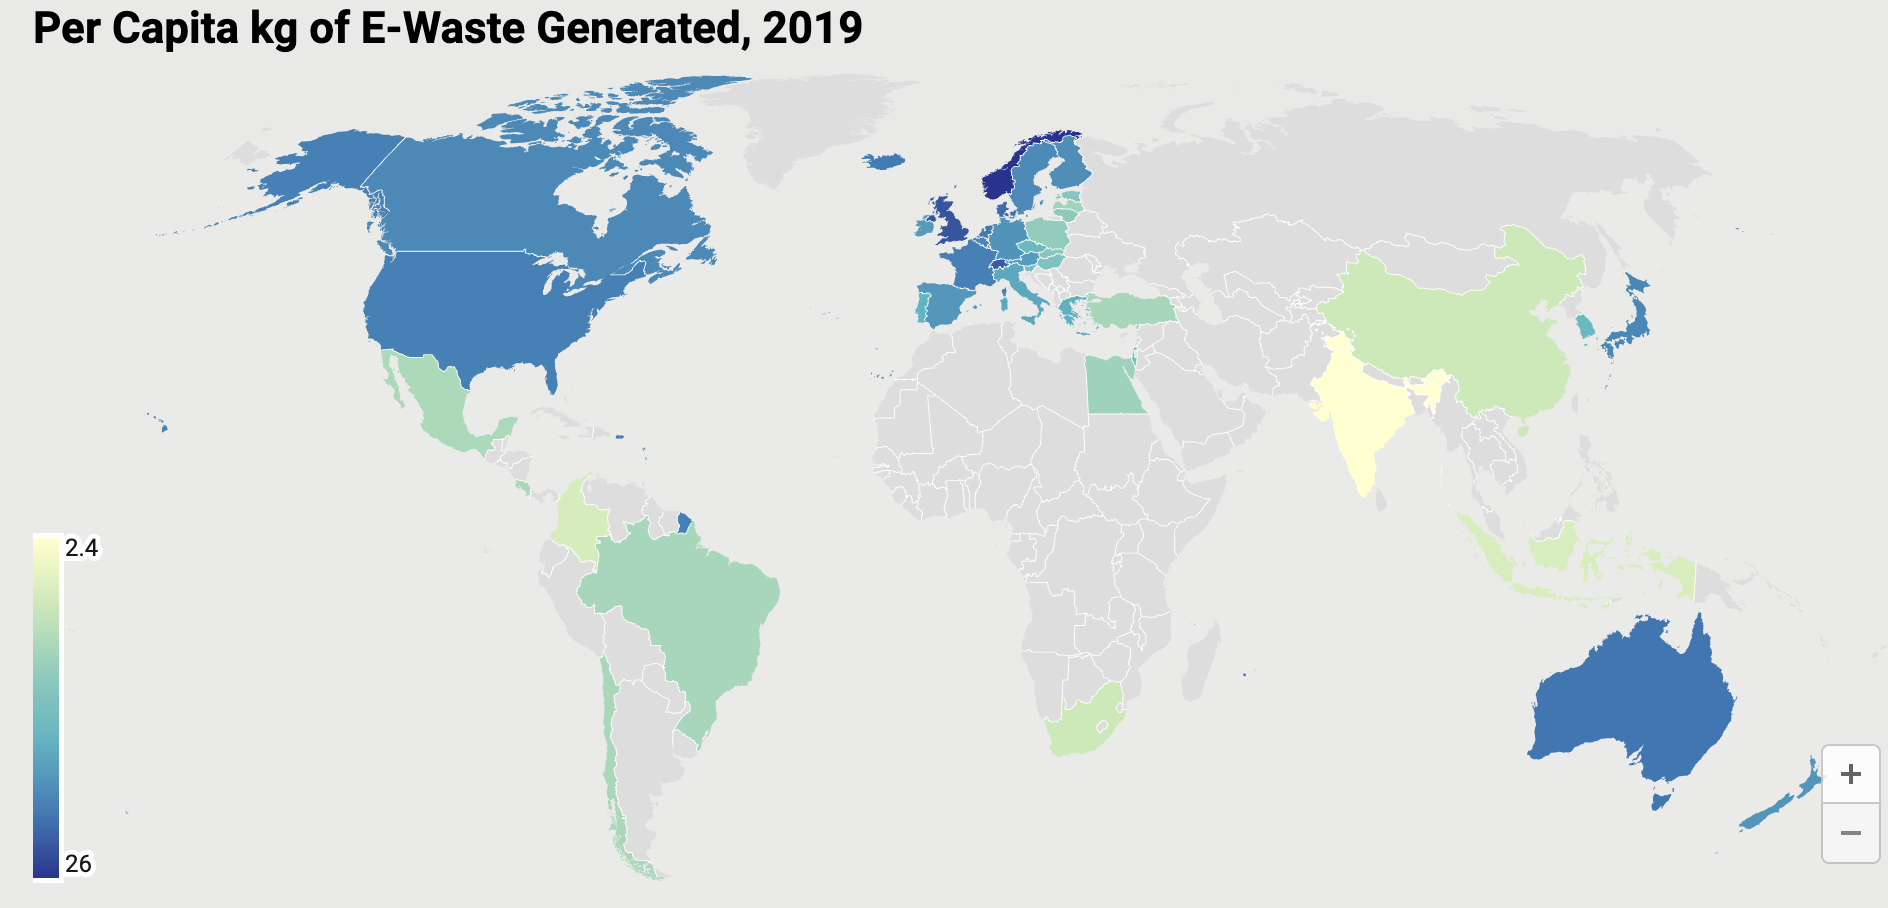
Web scraping of data center locations, geospatial mapping, choropleth visualization of per capita e-waste generation, and flow analysis comparing service consumption vs. waste burden.
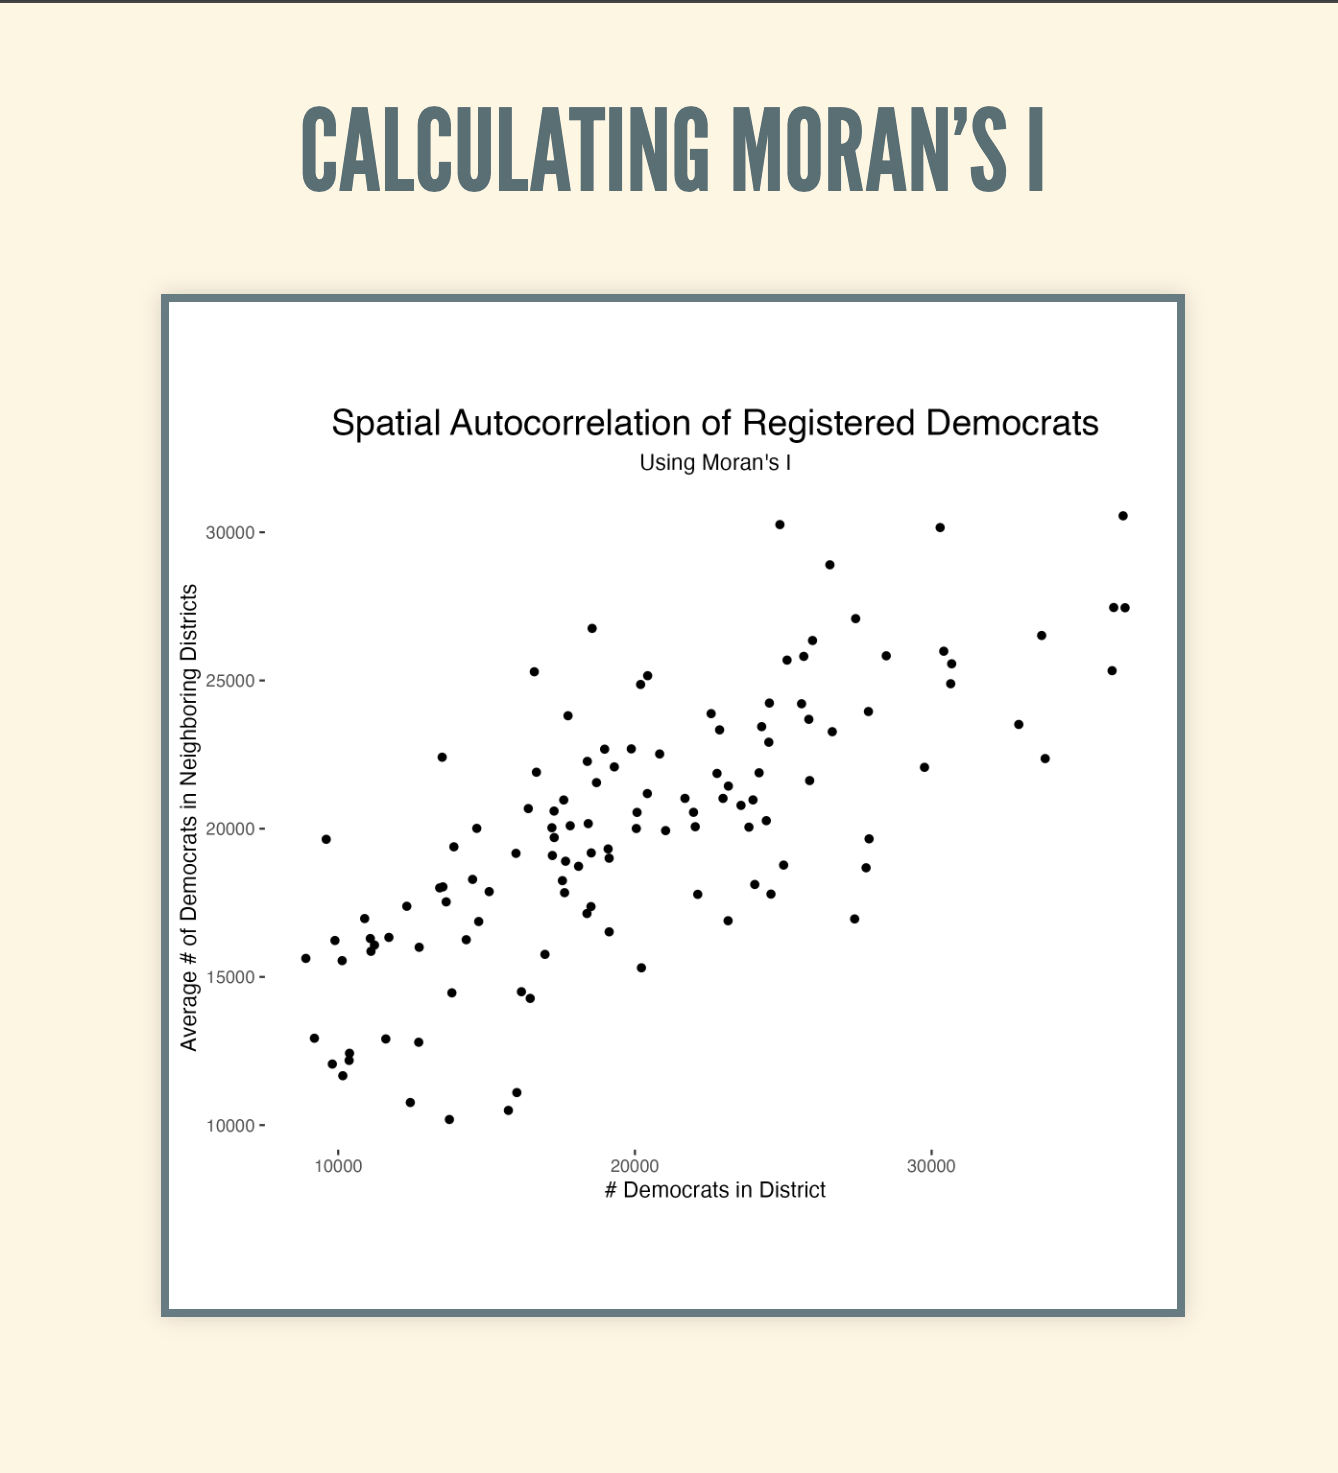
Neighbor matrix logic, decision tree algorithm (Gini impurity), spatial autocorrelation analysis, and interactive GIS visualizations.